LOOM MONITORING SYSTEM FOR TEXTILES
Datalog Online Monitoring System for Looms is an interactive real-time control system and centralized monitoring system for weaving in the textile industry.The Loom Data Logging System collects data from each loom and processes it to generate useful reports to ensure the smooth running of all operations resulting in higher profits. The performance of each loom in the textile mill is continuously monitored by the system, which prevents unwanted stoppages and increases productivity.
Products Range :-
Datalog Online Monitoring System Available for Looms of Any Type, Any Make, Any Model, Manufacturing Any Product.

BENEFITS OF DATALOG ONLINE LOOM MONITORING SYSTEM & LOOM DATA LOGGER CLIENTS
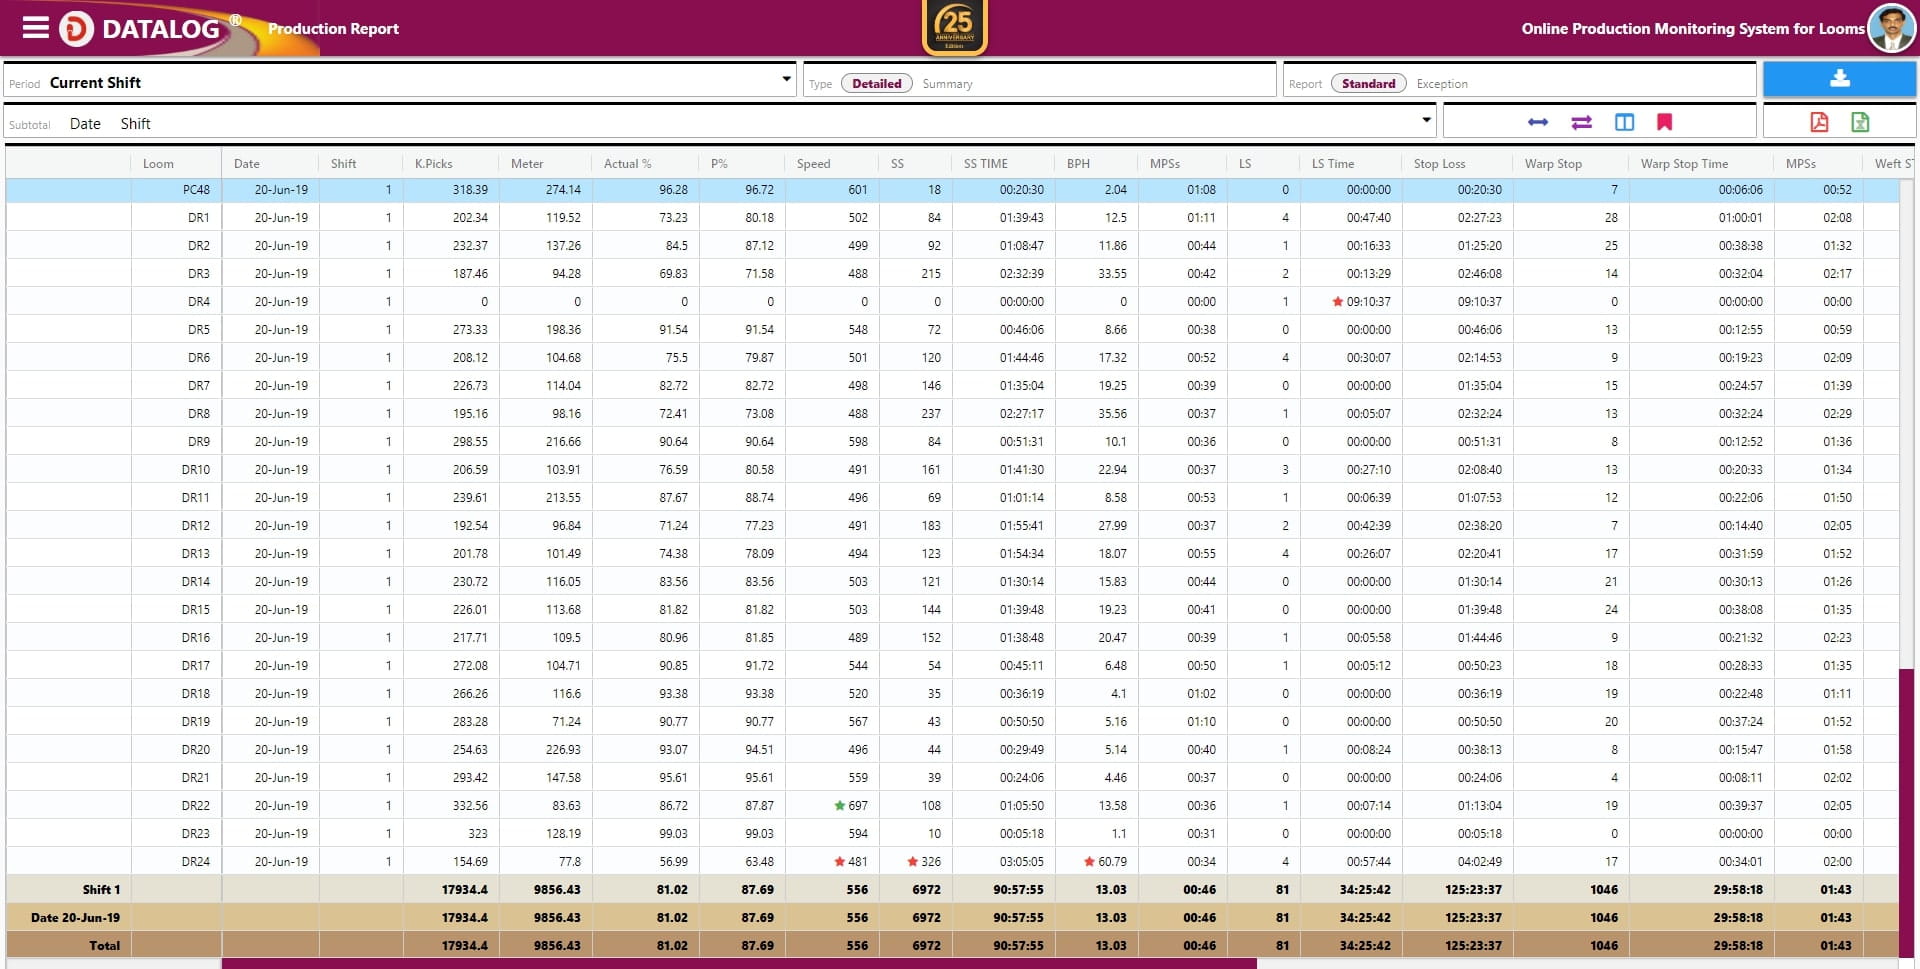
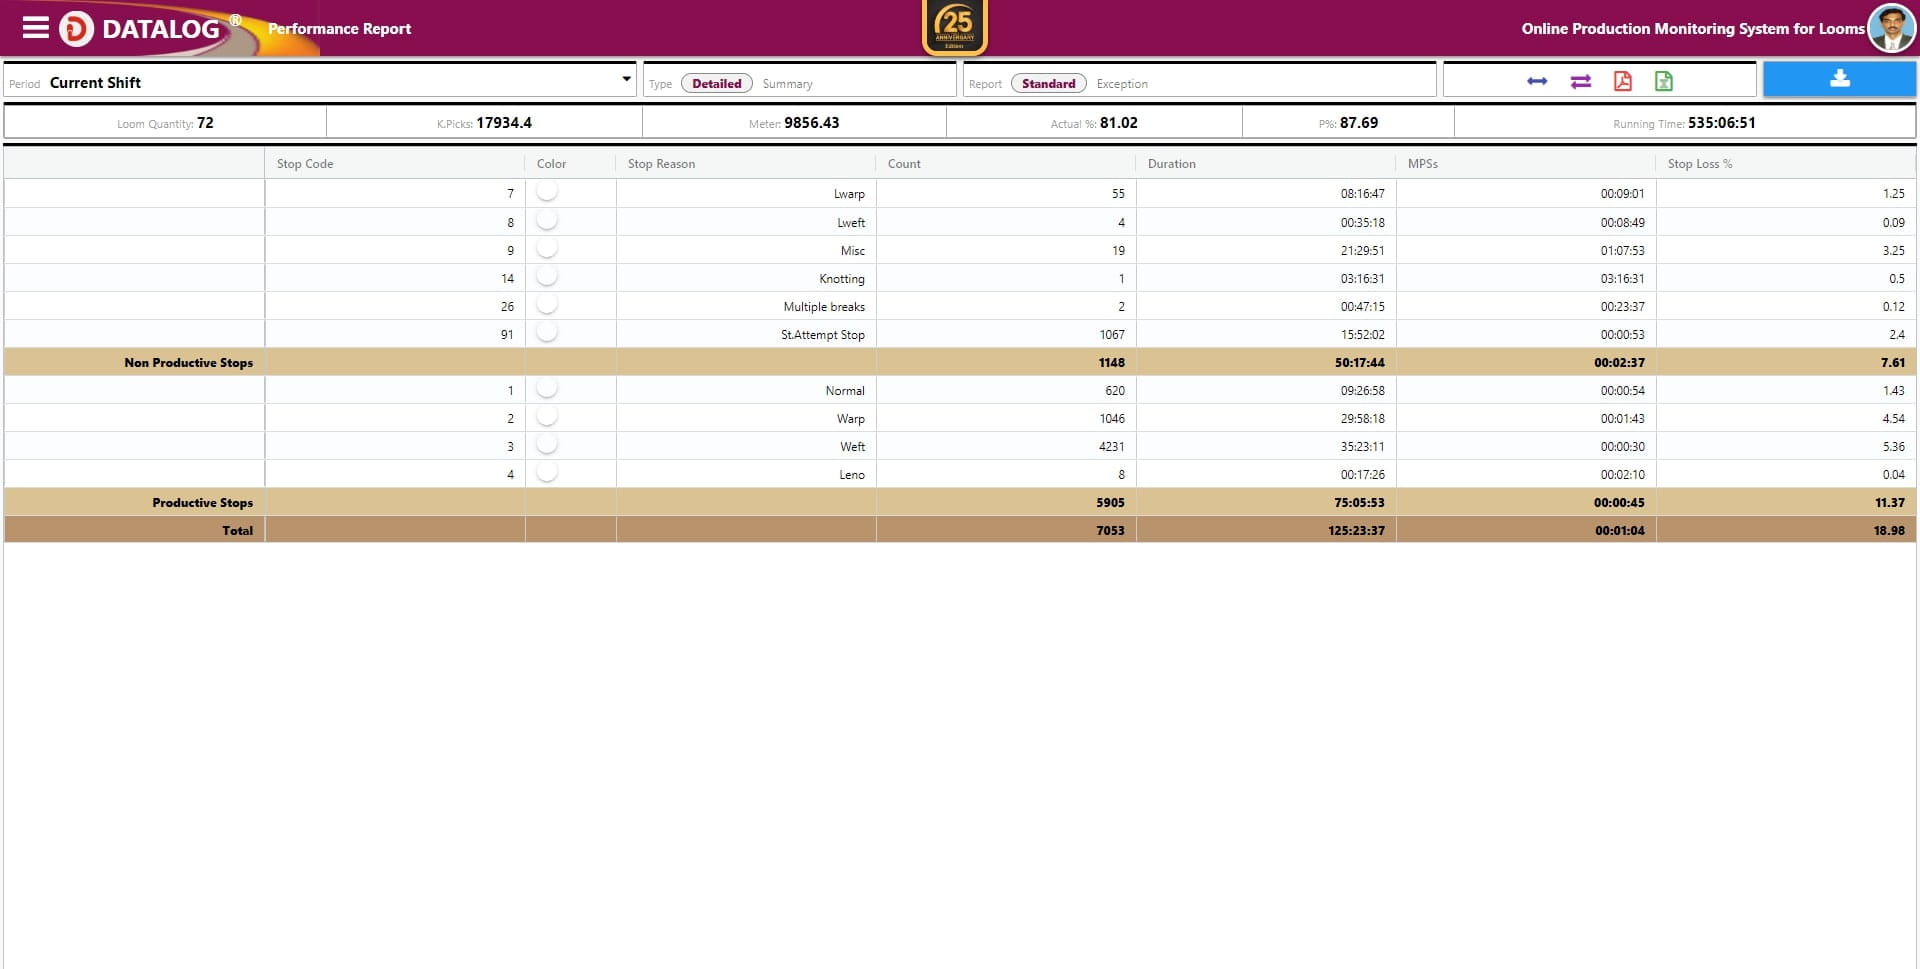
Production, Stoppage & Efficiency Monitoring
Comprehensive monitoring solution for all manufacturing equipment with real-time analytics and optimization tools.
Integrated information of all types of looms in one software
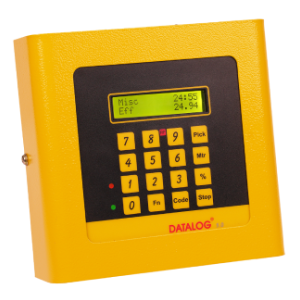
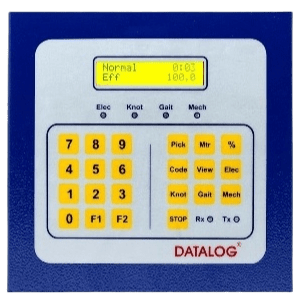
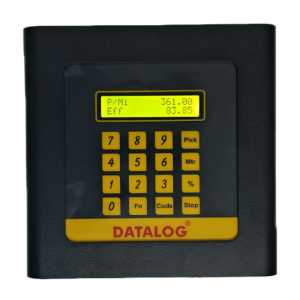
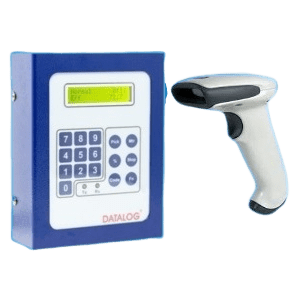
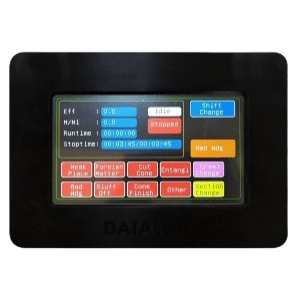
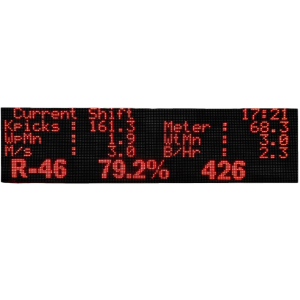
All loom data can be viewed on the machine terminal fitted to each loom
The reason for the long stop can be entered into the loom machine terminal
Web-based software & hence easy to access your loom data from within or outside the textile mill
A Mobile Version of our loom monitoring Software is also available
Also Compare Weavers to identify low performing weaver and train for better result
Reduce Machine Down Time by continuous monitoring of each loom
Continuous Monitoring of Breaks per Hour & Minutes per Stop for Warp, Weft and other stops
Compare Machines running with same Style to identify low performing machine and finetune
Automatic Weaver Planning
Advanced Analytics Features
- Efficiency Trend Graph to analyse Loom behaviour and finetune for better Efficiency
- Stop Diagram to find out repeated stops, too many stops and finetune the Loom
- Bring Low performing Loom at par with the best
- Exception Reports can be called for any parameter to analyse the weak areas
- Snap Study on every parameter
- Macro to Micro Analysis of any parameter can be called for long term analysis (Year – Month – Day)
- Easy Interface with any ERP
- Beam Planning Reports, Un Assigned Beam Reports are available
- Roll Doff Reports and Crimp Reports are available
Air Consumption Monitoring
Optimize your compressed air usage across the entire facility for maximum efficiency.
CFM of each Loom is monitored continuously to provide
- Instantaneous CFM
- Average CFM
- Cumulative CFM
- CFM / Meter of fabric produced
Air Consumption Report in Text & Graph for
- Loom Wise
- Shift Wise
- Style Wise
- Shed Wise
By Monitoring CFM Consumed – Cost per Meter can be analysed
Optimise Speed vs CFM consumed
Prevent Avoidable stops / Breakdowns
Power Monitoring
Comprehensive energy monitoring solution to reduce costs and improve efficiency.
- Reduce Power Bills (Cost)
- Arrive at Cost / Meter of fabric produced
- Speed vs Power Consumed
- Quality of Power
- Monitor Health of Motor and other related hardware
REPORTS, GRAPHS AND SCREENS
- General Reports
- Management Reports
- Comparison Reports
- Periodical Reports
- Power Graph & Reports
- Air Consumption-Graph & Reports
- Special Reports
- Production & stoppage reports with efficiency comparison
- Efficiency trend reports and stop analysis graphs
- True drill-down from macro (year) to micro (day) level insights
- Efficiency trend graphs of year, month, and day
- Reports viewable by Machine, Style, Weaver, Supervisor, and Department
- Assigned men tracking for accountability
- Snap study for quick performance evaluations
- Exception reports for outlier detection and quick resolution
- Stop bar graph to visualize machine running vs. stoppage over time
- Speed graph for monitoring machine speed consistency
- Roll doff reports for shift and production planning
- Beam planning and unassigned beam reports
- Crimp report for fabric quality and consistency checks
- Performance report for overall operational insights
- Long-term report to track historical data and trends
- Monthly report for consistent performance monitoring
- User-specific reports for personalized analysis
- Weavers comparison for performance benchmarking
- Supervisor comparison to evaluate management efficiency
- Loom comparison for machine-wise productivity analysis
- Style comparison to assess output across fabric styles
- Weekly reports to monitor short-term trends
- Monthly reports for regular performance reviews
- Hourly reports for real-time production tracking
- Two/Three shift reports for comparative shift analysis
- Power consumption tracking (KVA, KWh)
- Voltage monitoring for equipment stability
- Current measurement for electrical load analysis
- Power factor analysis for energy efficiency
- Frequency monitoring for consistent power supply
- Instantaneous CFM report for real-time airflow analysis
- Average CFM report to assess overall ventilation performance
- Cumulative CFM tracking for total airflow volume
- Meter/KG report for energy consumption per unit output
- Temperature and humidity graph & report for environmental monitoring
- Fabric defect report to ensure product quality control


MODELS & OPTIONAL ATTACHMENTS FOR LOOM